

Google BigQuery
Integrate Sifflet with BigQuery to monitor all table types, access field-level lineage, enrich metadata, and gain actionable insights for an optimized data observability strategy.

Metadata-based monitors and optimized queries
Sifflet leverages BigQuery's metadata APIs and relies on optimized queries, ensuring minimal costs and efficient monitor runs.

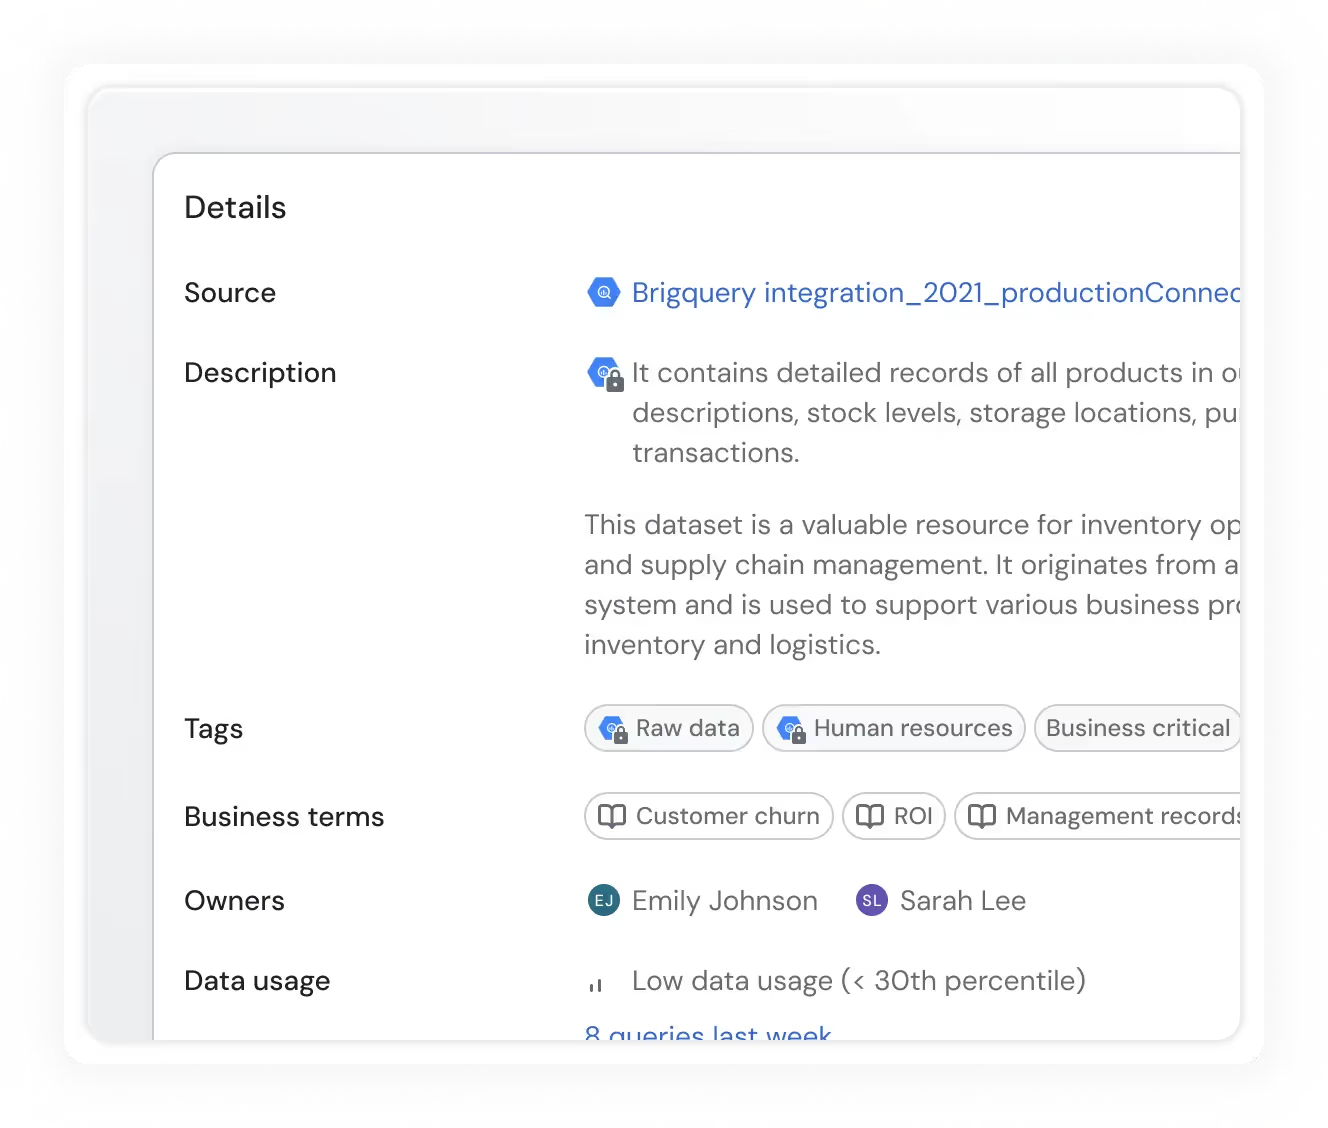
Usage and BigQuery metadata
Get detailed statistics about the usage of your BigQuery assets, in addition to various metadata (like tags, descriptions, and table sizes) retrieved directly from BigQuery.
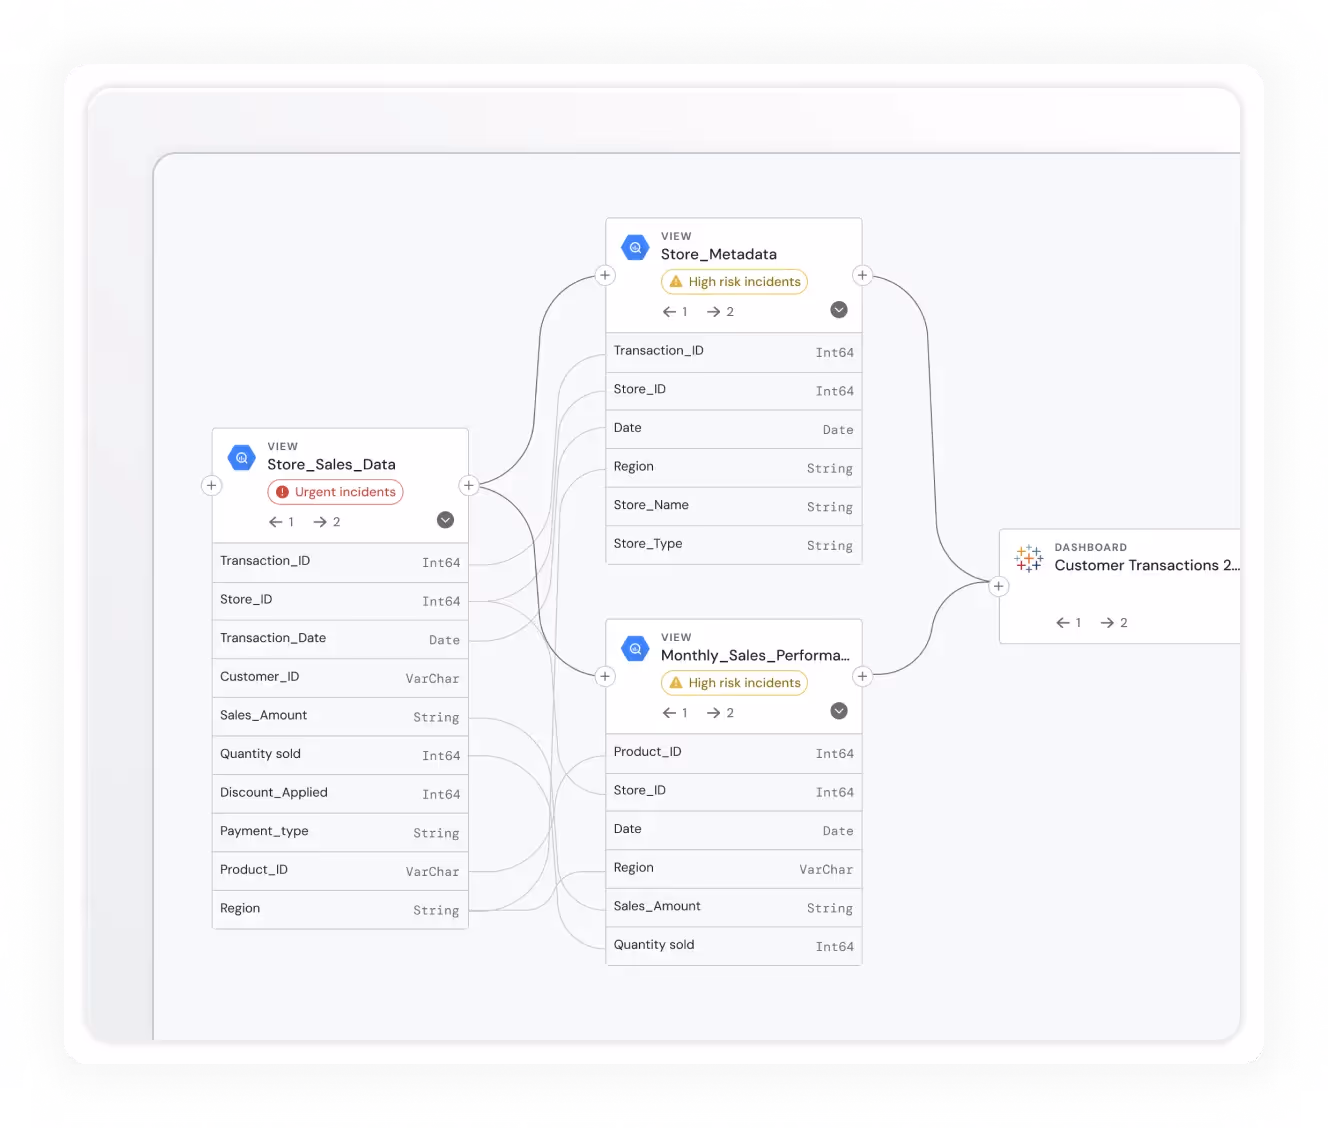
Field-level lineage
Have a complete understanding of how data flows through your platform via field-level end-to-end lineage for BigQuery.
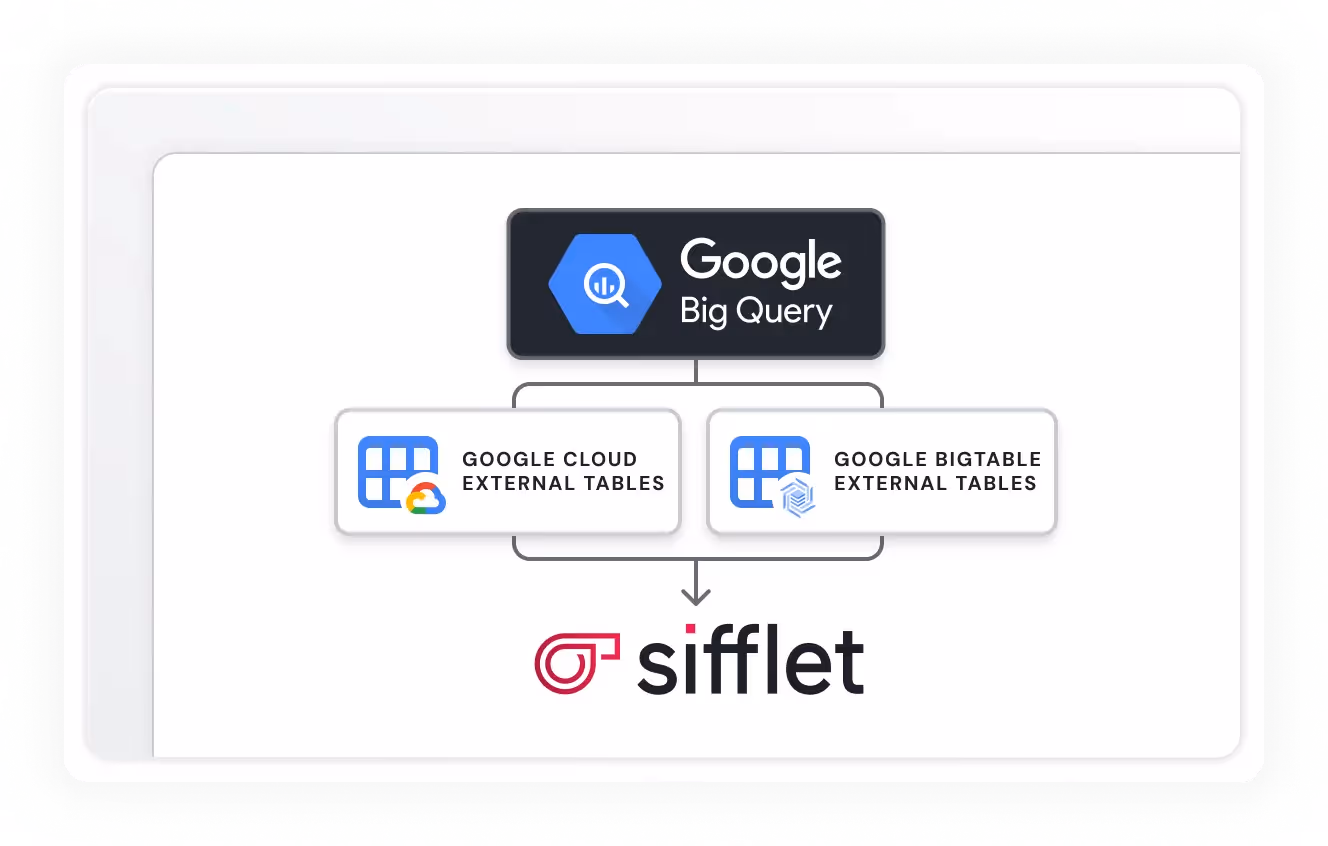
External table support
Sifflet can monitor external BigQuery tables to ensure the quality of data in other systems like Google Cloud BigTable and Google Cloud Storage

Sifflet’s AI Helps Us Focus on What Moves the Business

What impressed us most about Sifflet’s AI-native approach is how seamlessly it adapts to our data landscape — without needing constant tuning. The system learns patterns across our workflows and flags what matters, not just what’s noisy. It’s made our team faster and more focused, especially as we scale analytics across the business.


"Enabler of Cross Platform Data Storytelling"

"Sifflet has been a game-changer for our organization, providing full visibility of data lineage across multiple repositories and platforms. The ability to connect to various data sources ensures observability regardless of the platform, and the clean, intuitive UI makes setup effortless, even when uploading dbt manifest files via the API. Their documentation is concise and easy to follow, and their team's communication has been outstanding—quickly addressing issues, keeping us informed, and incorporating feedback. "

"Building Harmony Between Data and Business With Sifflet"

"Sifflet serves as our key enabler in fostering a harmonious relationship with business teams. By proactively identifying and addressing potential issues before they escalate, we can shift the focus of our interactions from troubleshooting to driving meaningful value. This approach not only enhances collaboration but also ensures that our efforts are aligned with creating impactful outcomes for the organization."

" Sifflet empowers our teams through Centralized Data Visibility"

"Having the visibility of our DBT transformations combined with full end-to-end data lineage in one central place in Sifflet is so powerful for giving our data teams confidence in our data, helping to diagnose data quality issues and unlocking an effective data mesh for us at BBC Studios"

"Sifflet allows us to find and trust our data"

"Sifflet has transformed our data observability management at Carrefour Links. Thanks to Sifflet's proactive monitoring, we can identify and resolve potential issues before they impact our operations. Additionally, the simplified access to data enables our teams to collaborate more effectively."

"A core component of our data strategy and transformation"
"Using Sifflet has helped us move much more quickly because we no longer experience the pain of constantly going back and fixing issues two, three, or four times."


Frequently asked questions


-p-500.png)
