
Mitigate disruption and risks
Customers choose Sifflet for migrations because it unifies lineage, monitoring, and triage in one place, giving teams clear, business-relevant insights without tool-switching. Its AI speeds up root cause analysis, learns your environment, and cuts manual effort, typically going live in under an hour and scaling fully in six weeks.


Pre-Migration: Baseline and Prepare
Create a complete inventory and establish trust baselines before any data is moved.
What Sifflet enables
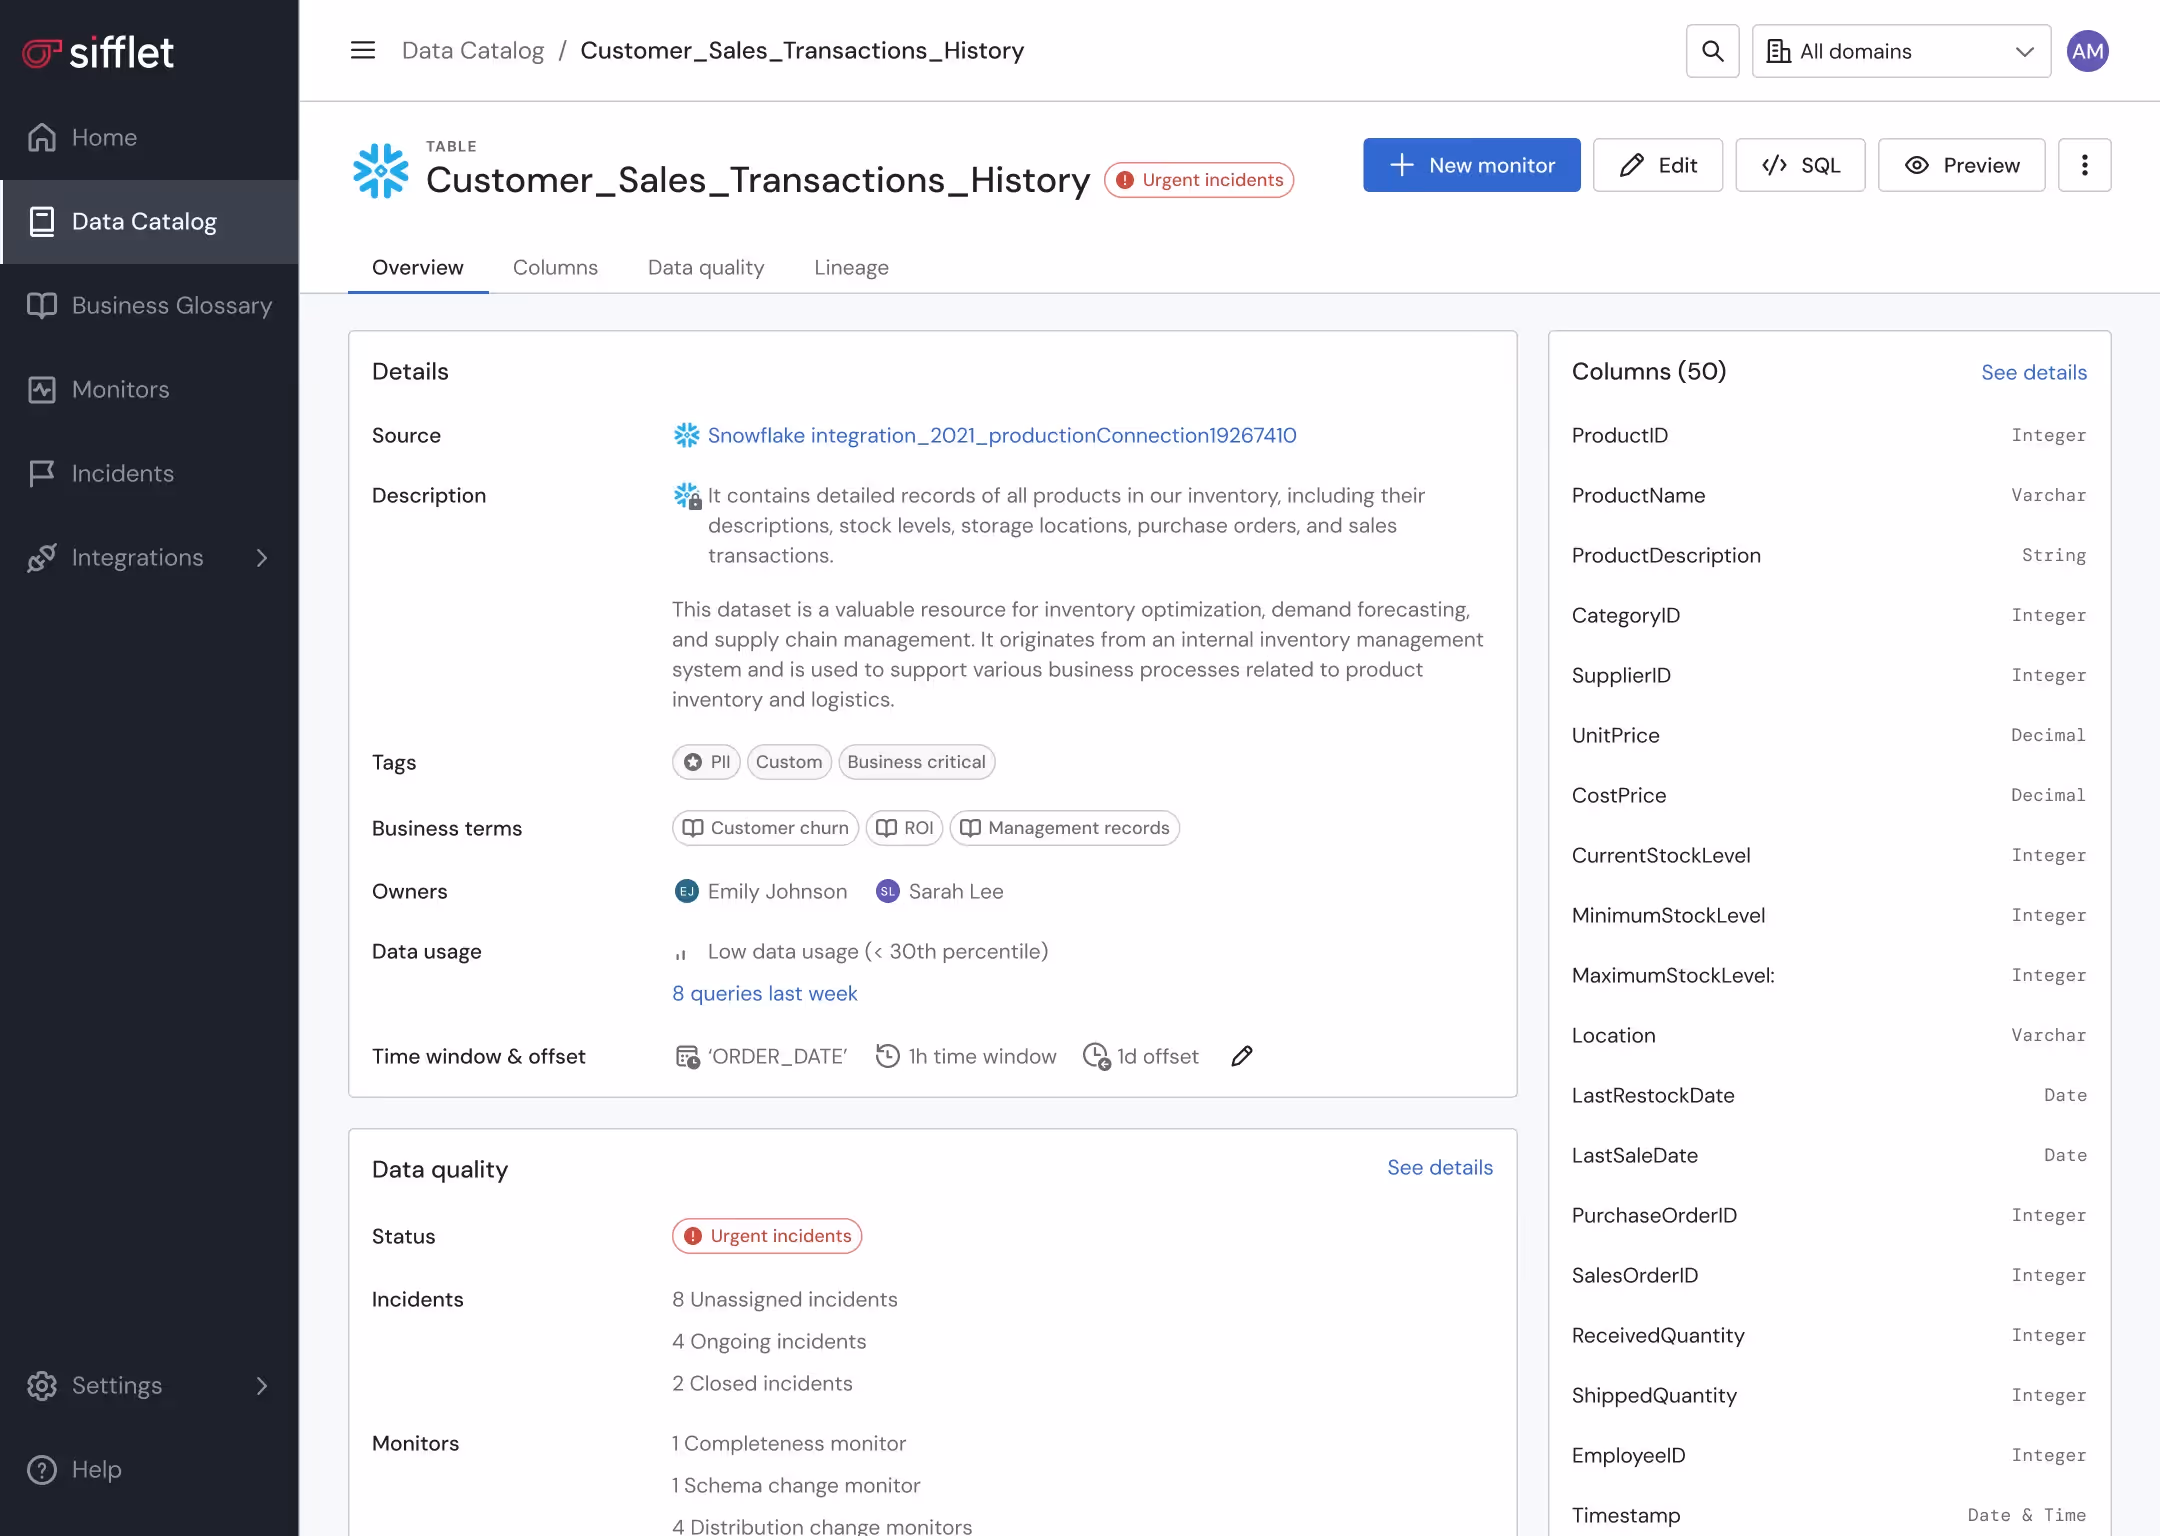
• End-to-end lineage mapping across your on-prem estate, so you know exactly which tables, dashboards, and KPIs depend on each other before changing pipelines.
• Automated data profiling and health scoring to establish quality baselines (volumes, distributions, freshness, schema shape) for every critical asset.
• Domain-level ownership so each business area knows its scope and responsibilities ahead of the migration.
• Monitors as Code to version and package all checks that will run pre- and post-migration.
Outcome: A clear, auditable understanding of what “good” looks like before the first batch of data is moved.
.avif)
During Migration: Parallel Validation and Controlled Cutover
Continuously validate data between your on-prem and Snowflake environments.
What Sifflet enables
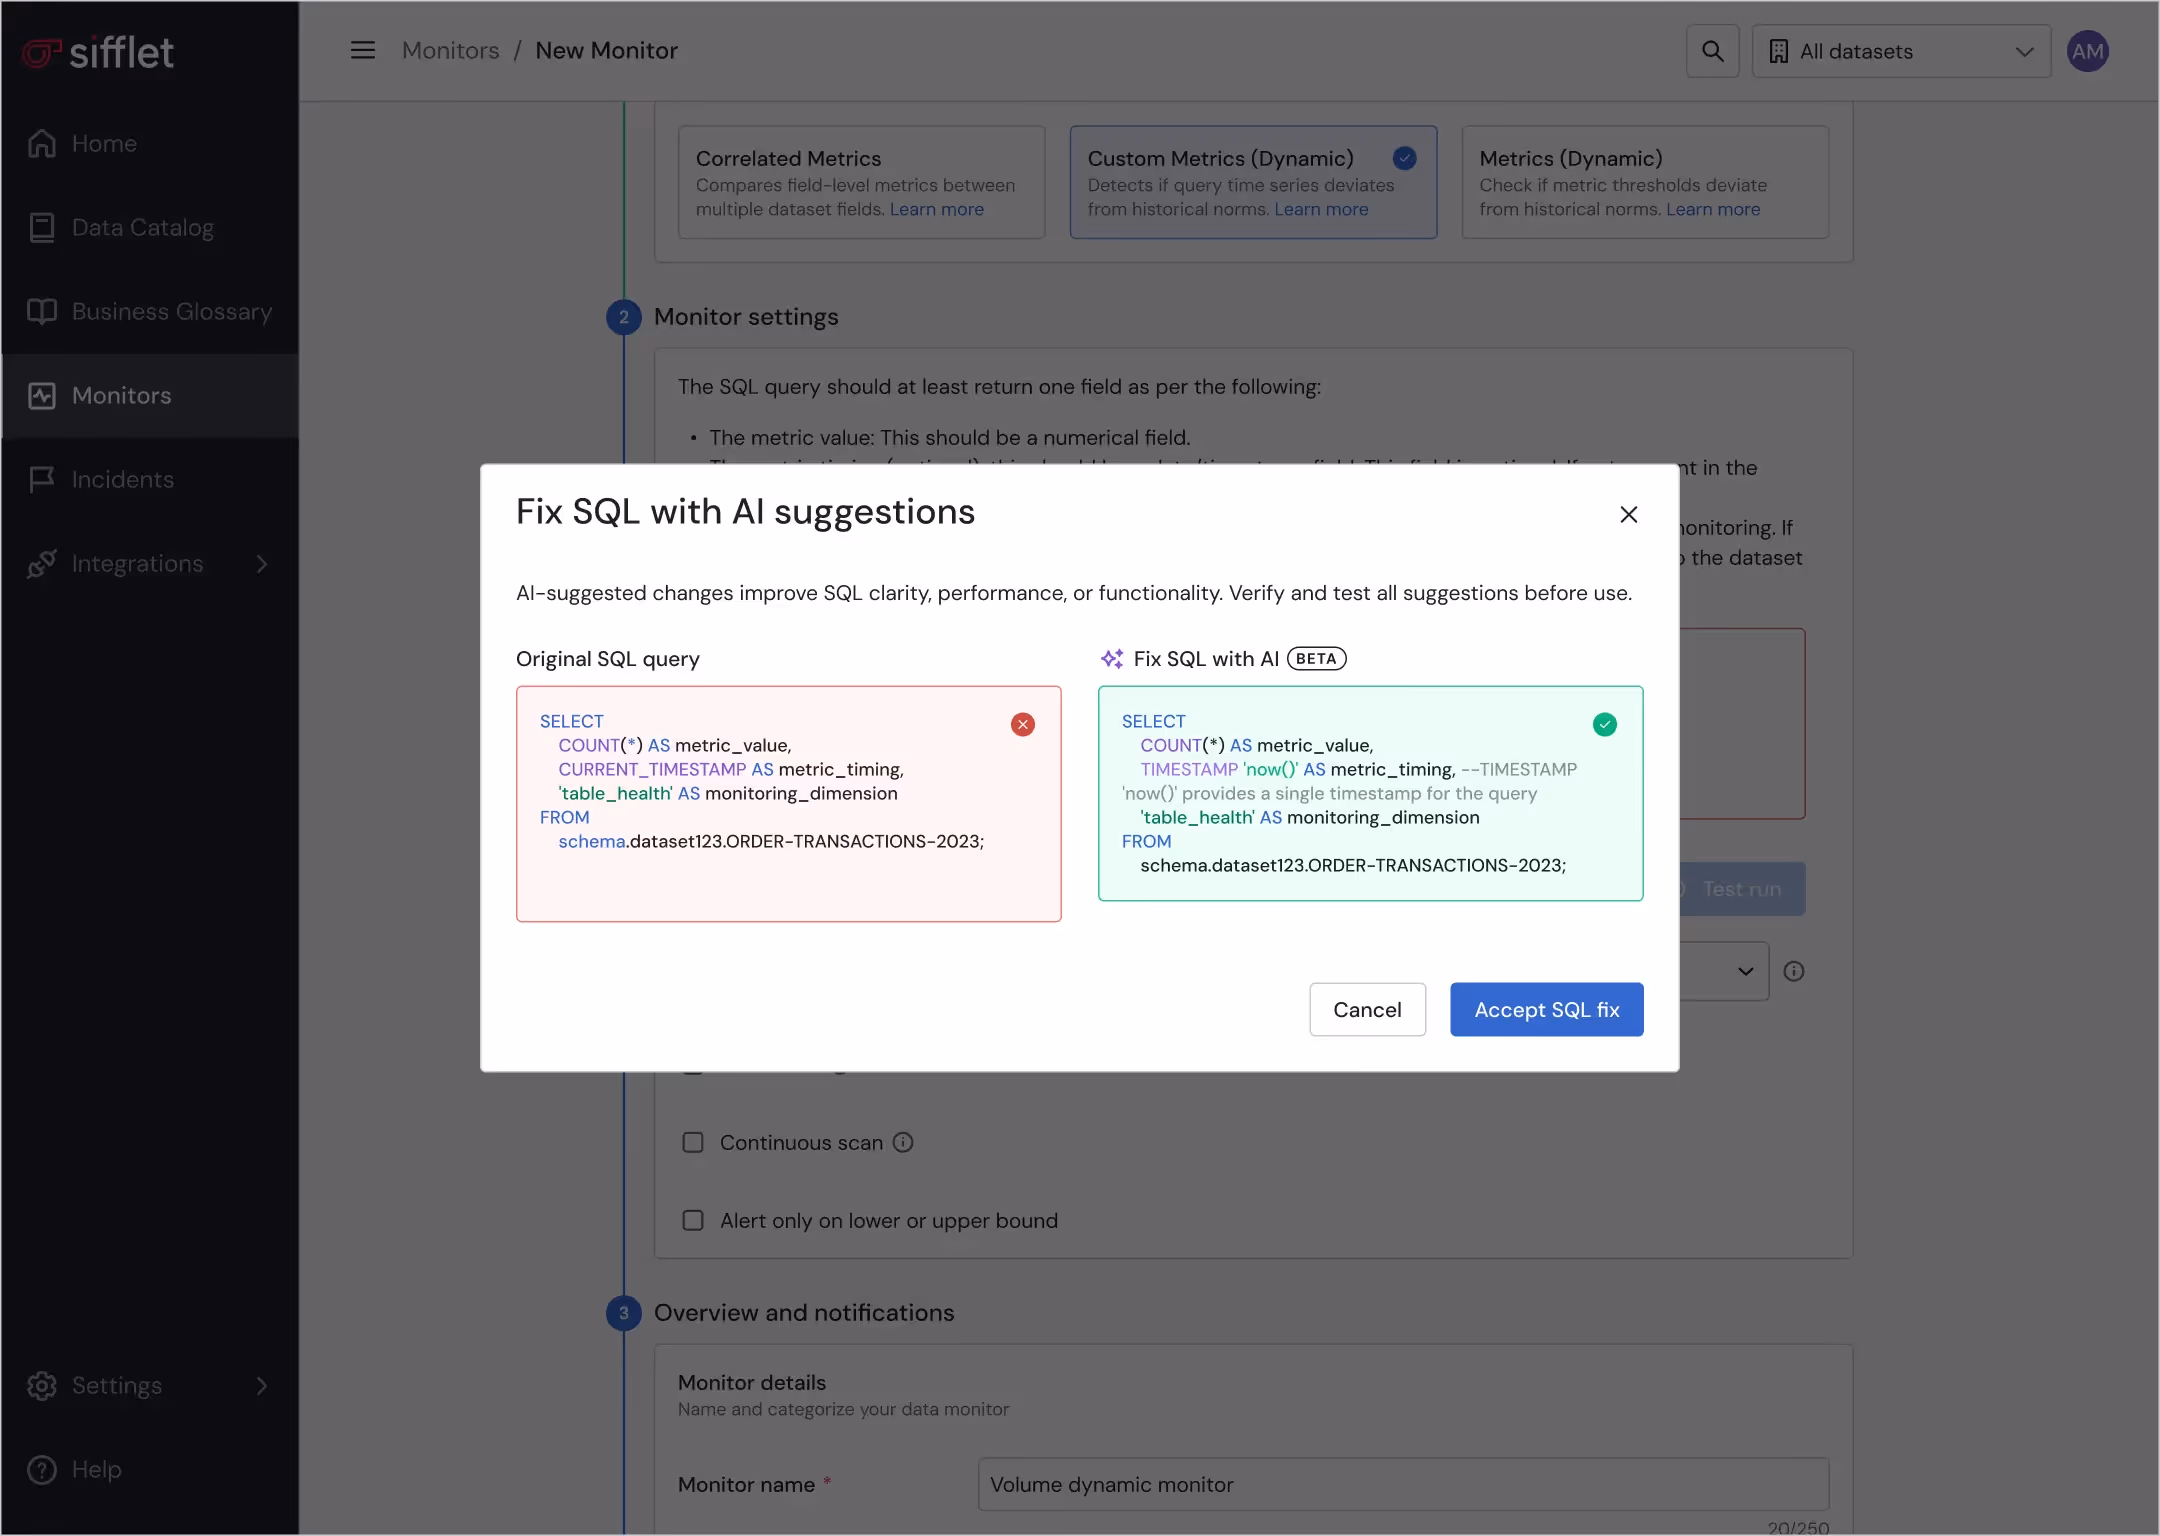
• Automated cross-environment comparison checks using custom SQL monitors, dynamic tests, and Sifflet’s failing-rows view.
• Adaptive anomaly detection with seasonal awareness to catch regressions introduced by new pipelines or refactored logic.
• Incident-centric workflow to consolidate related alerts, generate AI-driven root cause analysis, and route to the right domain team.
• Field-level lineage to understand the blast radius of every upstream change as migration waves progress.
Outcome: Fast detection of mismatches, broken joins, missing data, or schema drift without manual spot-checking.
Post-Migration: Stabilise and Scale
Ensure production-grade reliability in Snowflake after cutover.
What Sifflet enables
• Auto-coverage and Monitor Recommendations (Sentinel) to close blind spots and automatically instrument new Snowflake tables.
• BI-embedded notifications (Power BI, Tableau, Looker) to alert business teams when downstream metrics change.
• Data Product views and SLAs to formalise trust in the new ecosystem and expose quality metrics to stakeholders.
• Cost-efficient observability with workload tagging and percent compute overhead to keep Snowflake spend predictable.
Outcome: A stable, trusted Snowflake environment with observability built in, not bolted on.
Sifflet’s AI Helps Us Focus on What Moves the Business
What impressed us most about Sifflet’s AI-native approach is how seamlessly it adapts to our data landscape — without needing constant tuning. The system learns patterns across our workflows and flags what matters, not just what’s noisy. It’s made our team faster and more focused, especially as we scale analytics across the business.


"Enabler of Cross Platform Data Storytelling"
"Sifflet has been a game-changer for our organization, providing full visibility of data lineage across multiple repositories and platforms. The ability to connect to various data sources ensures observability regardless of the platform, and the clean, intuitive UI makes setup effortless, even when uploading dbt manifest files via the API. Their documentation is concise and easy to follow, and their team's communication has been outstanding—quickly addressing issues, keeping us informed, and incorporating feedback. "

"Building Harmony Between Data and Business With Sifflet"
"Sifflet serves as our key enabler in fostering a harmonious relationship with business teams. By proactively identifying and addressing potential issues before they escalate, we can shift the focus of our interactions from troubleshooting to driving meaningful value. This approach not only enhances collaboration but also ensures that our efforts are aligned with creating impactful outcomes for the organization."

" Sifflet empowers our teams through Centralized Data Visibility"
"Having the visibility of our DBT transformations combined with full end-to-end data lineage in one central place in Sifflet is so powerful for giving our data teams confidence in our data, helping to diagnose data quality issues and unlocking an effective data mesh for us at BBC Studios"

"Sifflet allows us to find and trust our data"
"Sifflet has transformed our data observability management at Carrefour Links. Thanks to Sifflet's proactive monitoring, we can identify and resolve potential issues before they impact our operations. Additionally, the simplified access to data enables our teams to collaborate more effectively."

"A core component of our data strategy and transformation"
"Using Sifflet has helped us move much more quickly because we no longer experience the pain of constantly going back and fixing issues two, three, or four times."

Discover more title goes here
Frequently asked questions


-p-500.png)
