


Definition
Data observability is the practice of monitoring, understanding, and ensuring the health of your data systems, so you can trust the data that powers your business decisions and data products, like recommendation engines or AI models. Think of it as quality control for your modern data stack.
Companies rely on large amounts of data. However, the more information your company holds, the more issues can arise, and the harder it can become to track.
Issues can go from broken pipelines, to missing fields, to schema changes.
The problem? Issues ripple downstream and impact the entire organization through dashboards, recommendation engines, AI models, and forecast.
Enter data observability.
Datda observability detects issues early, understands their root cause, and resolves them before they damage trust in data.
Example
Imagine this: you're the VP of Operations at a major retail chain managing hundreds of stores nationwide. Black Friday is approaching, and your demand forecasting model predicts record inventory needs. But three days before the big weekend, sales projections suddenly plummet across all categories. Panic sets in. Is consumer demand really crashing, or is something wrong with your data?
After hours of investigation, you discover the issue: your point-of-sale systems stopped syncing transaction data from your mobile app. For 48 hours, you've been forecasting based on incomplete sales data, missing nearly 40% of actual customer purchases. Your inventory is already being redistributed based on flawed predictions.
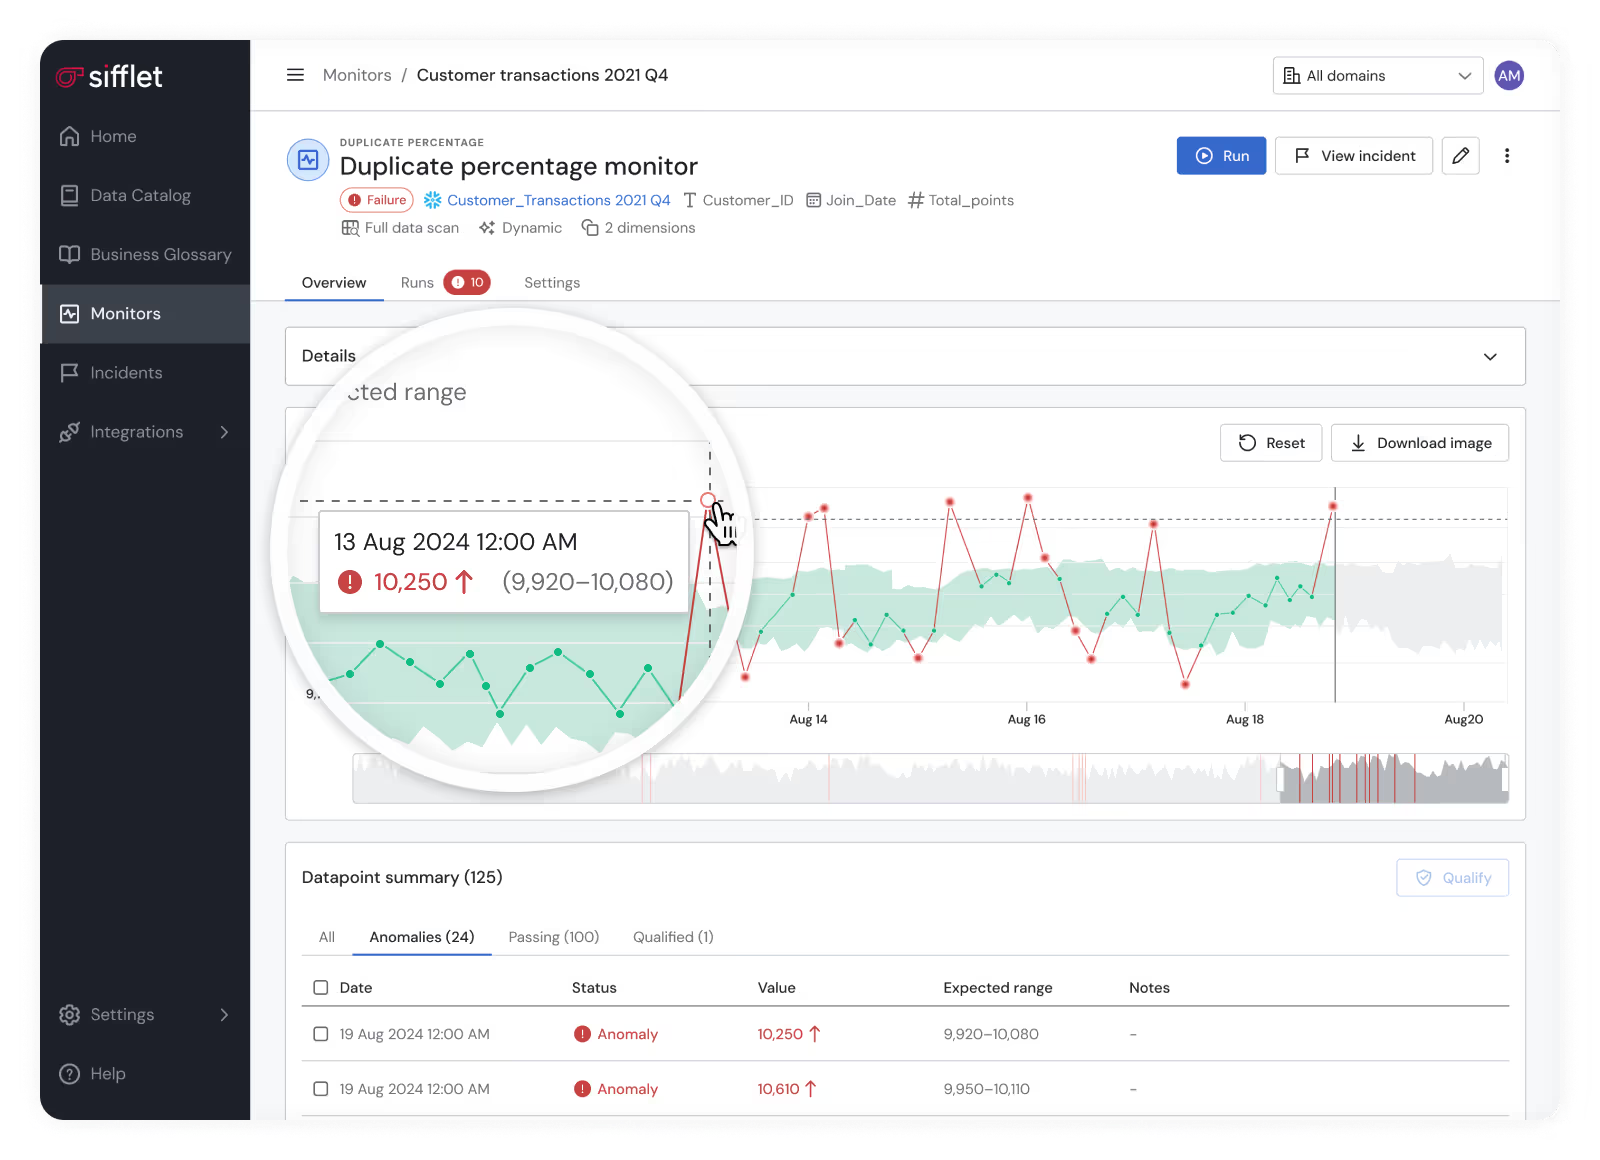
With Sifflet in place, this crisis is avoided. The moment transaction volumes drop unexpectedly, Sifflet detects the anomaly, traces it back to the mobile app data sync failure, and alerts your team immediately.
Instead of discovering the problem days later through missed sales targets, you catch it within hours and keep your Black Friday preparations on track.
A single data failure can cascade into revenue loss, operational chaos, and damaged customer trust.
With observability, you catch issues before they become crises. It’s your insurance policy against expensive, hidden mistakes.
What is Data Observability?
Data observability is the process of watching over your whole data platform so you can monitor and fix any issues that can arise.
Although there is a little more to it.
While most data observability tools tell you when your data breaks, true data observability tells you why it matters.
Data observability isn't just monitoring pipelines or catching schema changes, it's the intersection of technical reliability and business impact.
It connects the dots between a broken table and a compromised executive dashboard, between upstream anomalies and downstream model drift.
While traditional monitoring asks "Is the pipeline fresh?", real observability asks the questions that actually drive decisions:
- Is this dashboard still reliable for our board presentation?
- Did this model train on broken inputs that could mislead customers?
- Will this schema change break the forecast our CFO presents next week?
The difference? Context changes everything.
Without business context, you're just firefighting alerts.
With it, you're protecting revenue, ensuring AI reliability, and maintaining stakeholder trust.
Sifflet weaves together technical signals, usage patterns, and business impact, so you're not just detecting issues, you're resolving the ones that actually threaten your business outcomes.
What Makes Data Observable?
Before you can observe your data effectively, you need to understand what you're actually observing.
Data isn't just numbers in tables, it's a complex ecosystem of characteristics, relationships, and interactions that all influence reliability and business impact.
True data observability requires visibility across four fundamental dimensions:
- Metrics show you what is changing
- Metadata tells you why it matters
- Lineage reveals what's affected
- Logs explain how it happened
Metrics
The internal DNA of your data.
These are the quantitative characteristics that describe your data's health from the inside, such as summary statistics, distributions, value patterns, and quality scores.
For numerical data, this includes measures like mean, standard deviation, and skewness. For categorical data, it's uniqueness, cardinality, and frequency distributions.
Why this matters for observability: Metrics help detect subtle changes in data quality that might not trigger schema or volume alerts but could still compromise downstream analytics or AI models.
Metadata
The context that makes data meaningful.
The information about your data: table descriptions, column definitions, data types, ownership, update schedules, and business purpose.
This includes technical metadata (when was it last updated?) and business metadata (what decisions depend on this dataset?).
Why this matters for observability: Without metadata, you're flying blind. A broken pipeline is just noise until you know it feeds the executive dashboard your CFO presents to the board.
Lineage
The web of dependencies and map of your data flow.
Data lineage represents the map of how data flows through your organization, from raw sources through transformations to final consumption in dashboards, models, and business processes.
This reveals not just where data comes from, but what breaks when it fails.
Why this matters for observability: When something goes wrong, lineage shows you the blast radius. It's the difference between "a table is late" and "this will impact three marketing campaigns and the quarterly forecast."
Logs
The story of your data in motion.
The record of all interactions with your data, including pipeline runs, transformations, queries, model training, dashboard refreshes, and user access patterns.
These capture both machine-generated events (ETL jobs, automated processes) and human interactions (analyst queries, model builds).
Why this matters for observability: Logs provide the forensic trail for root cause analysis and help predict where future issues might emerge based on usage patterns and historical failures.
Most monitoring tools focus on just one or two dimensions.
They might track freshness (logs) or enforce quality rules (metrics), but they can't connect a schema change to its downstream business impact or prioritize alerts based on who's actually using the data.
At Sifflet, we unify signals across all four dimensions to give you observability that's not just comprehensive, but contextually intelligent.
What are the Pillars of a Data Observability Framework?
Most platforms focus on technical health. Sifflet focuses on business impact.
A complete data observability framework operates on two levels: solid technical foundations that detect issues, and business intelligence that transforms those signals into strategic action.
5 technical pillars of data observability
These are the technical signals every observability platform should monitor:
- Freshness: Is my data current and arriving on schedule?
- Volume: Am I getting the expected amount of data?
- Schema: Has my data structure changed unexpectedly?
- Distribution: Are my data values falling within expected patterns?
- Lineage: How does data flow through my systems and what depends on it?
But here's where most tools stop and where the real problems begin.
Technical health doesn't tell you business impact. A delayed pipeline might be critical for your board presentation or irrelevant to any current decision-making.
3 strategic pillars for business intelligence
This is where Sifflet transforms technical signals into business-aligned action:
- Detection with precision
- Monitor all 5 technical pillars, but prioritize alerts based on downstream business usage
- Deploy AI-driven agents that distinguish between "table is late" and "executive dashboard is compromised"
- Filter noise to surface only anomalies that threaten business outcomes
- Triage with context
- Map technical incidents to affected dashboards, models, and KPIs
- Score business impact: Does this affect quarterly reporting? Customer-facing features? AI model performance?
- Bridge data producers and consumers with shared visibility into what's actually at stake
- Resolution with velocity
- Route issues to the right teams with full business context via Slack, Jira, or Notion
- Trigger automated playbooks for known patterns
- Create feedback loops that prevent repeat incidents and build organizational trust
The result? Technical observability that serves business strategy. Instead of alert fatigue, you get protection for revenue-critical processes, AI reliability, and stakeholder confidence.
In other words, the 5 technical pillars tell you what's broken. The 3 strategic pillars tell you why it matters and what to do about it.
Data Observability vs Data Quality, Data Monitoring, and Data Governance
These terms often get used interchangeably by mistake. They're not the same, and the differences matter for your data strategy:
Here's the critical difference:
- Monitoring tells you a pipeline failed
- Quality tells you a value violates a rule
- Governance tells you who owns what and what policies apply
- Observability tells you what actually matters:
- Is this data reliable enough for the decisions depending on it?
- What broke, where, why—and who's affected downstream?
- Is this urgent enough to wake someone up, or can it wait until Monday?
- How do we fix it fast and prevent it from happening again?
At Sifflet, we don't replace your monitoring, quality, or governance tools, we make them business-aware.
We unify signals across your entire data stack, then overlay the context that transforms noise into action: lineage, usage patterns, stakeholder impact, and resolution workflows.
The result?
Your team stops chasing every alert and starts protecting what drives business outcomes. It's not just about catching problems, it's about preserving trust and ensuring that when data breaks, you know exactly why it matters and what to do next.
Who Needs Data Observability?
Anyone whose success depends on trusted data.
Yes, basically everyone.
Data observability isn't just for data engineers anymore. It's become critical infrastructure for cross-functional teams who can't afford to make decisions on unreliable information:
- Data engineers and platform teams: Stop firefighting every pipeline hiccup and focus on issues that actually impact business outcomes
- Analytics engineers and BI leads: Maintain dashboard integrity and prevent executives from presenting broken metrics to the board
- Data scientists and MLOps teams: Catch silent model drift and upstream anomalies before they mislead customers or corrupt predictions
- RevOps, marketing and sales operations: Protect campaign attribution, forecasting models, and pipeline reporting from data failures
- Finance and strategy Teams: Ensure quarterly reports, budgets, and investor metrics are built on verified, trustworthy inputs
- Executives and CDOs: Make confident decisions knowing your data infrastructure protects against silent failures and business-critical blind spots
The shift is clear: data isn’t mere support for your business, it drives it.
AI initiatives, real-time personalization, automated decision-making…all of these depend on data that's not just fresh, but trustworthy at the moment of use.
What Does an Observability Stack Look Like?
A complete observability layer doesn't replace your existing tools, it makes them all more trustworthy.
True observability connects across your entire data ecosystem, providing the missing context that transforms technical alerts into business-aligned action.
Here's how observability fits into a modern data stack:
Your stack already generates thousands of signals about data health. What's missing is the context to know which signals actually matter for business outcomes.
Sifflet sits at the center, ingesting metadata and quality signals from every layer, then mapping them to the dashboards, models, and decisions that depend on reliable data.
The result? Instead of drowning in alerts from six different tools, your teams get prioritized insights about what's broken, who's affected, and what to fix first.
How to Implement Data Observability?
The biggest mistake organizations make? Treating observability like another monitoring tool to "set and forget."
Successful implementation requires both technical setup and organizational alignment, because observability is only as valuable as the actions it enables.
Phase 1: Foundation Setup (Weeks 1-4)
Start with your most business-critical data flows first. Don't try to observe everything, just focus on the datasets that directly impact revenue, compliance, or executive decision-making.
Essential technical capabilities to prioritize:
- Automated monitoring across the 5 core pillars (freshness, volume, schema, distribution, lineage)
- Anomaly detection powered by ML models that learn your data patterns, not just static rules
- Data lineage tracking to map dependencies from sources to business outcomes
- Integration with your existing stack: data warehouses, orchestration tools, BI platforms
Key setup principle: Configure detection with business context from day one. Don't just monitor table freshness, monitor whether delays affect quarterly reporting, customer-facing dashboards, or AI model performance.
Phase 2: Contextual Intelligence (Weeks 4-8)
This is where most implementations fail. Technical monitoring without business context creates alert fatigue, not insights.
Build business-aware triage capabilities:
- Impact scoring that prioritizes incidents based on downstream usage and stakeholder importance
- Root cause analysis tools that connect technical failures to business processes
- Cross-functional workflows linking data producers (engineers) with consumers (analysts, executives)
- Customizable alerting that routes the right information to the right teams at the right time
Success metric: Your team stops asking "What broke?" and starts asking "What should we fix first?"
Phase 3: Resolution Acceleration (Weeks 8-12)
Turn insights into outcomes. The fastest detection means nothing if resolution is slow or misdirected.
Implement collaborative resolution workflows:
- Integrated notifications via Slack, Jira, Notion, or ServiceNow that include full business context
- Automated playbooks for common incident types (schema changes, volume drops, freshness delays)
- Feedback loops between data teams and business stakeholders to prevent repeat issues
- Historical trend analysis to predict and prevent future problems
What to Look for in an Observability Platform
Not all tools are created equal.
Here's how to separate business-ready platforms from engineering-only monitoring:
Now, if you’re looking for the best observability tool, we have gathered our favorites.
Final thoughts…
Businesses are built on data and data platforms are getting more complex each day.
It's crucial to make sure that your data platform runs smoothly and reliably.
A data observability tool can:
- Detect anomalies
- Monitor pipeline health
- Trace data lineage
- Alert in real time
- Reduce data downtime
However, it has to be done right and with the best tools.
If you want to measure your data observability tool’s success, don’t track MTTR or alert volume. Measure business impact by asking yourself these questions:
- Are business teams using self-service analytics more confidently?
- Are executives making faster decisions with data-backed confidence?
- Are data producers and consumers aligned on priorities?
- Are you catching issues before they reach business stakeholders?
Ready to align data reliability and health with how your business runs? Try Sifflet today.


-p-500.png)
